Observability and Operations
Build the instrumentation that lets you understand what your system is doing in production.
Lesson goal
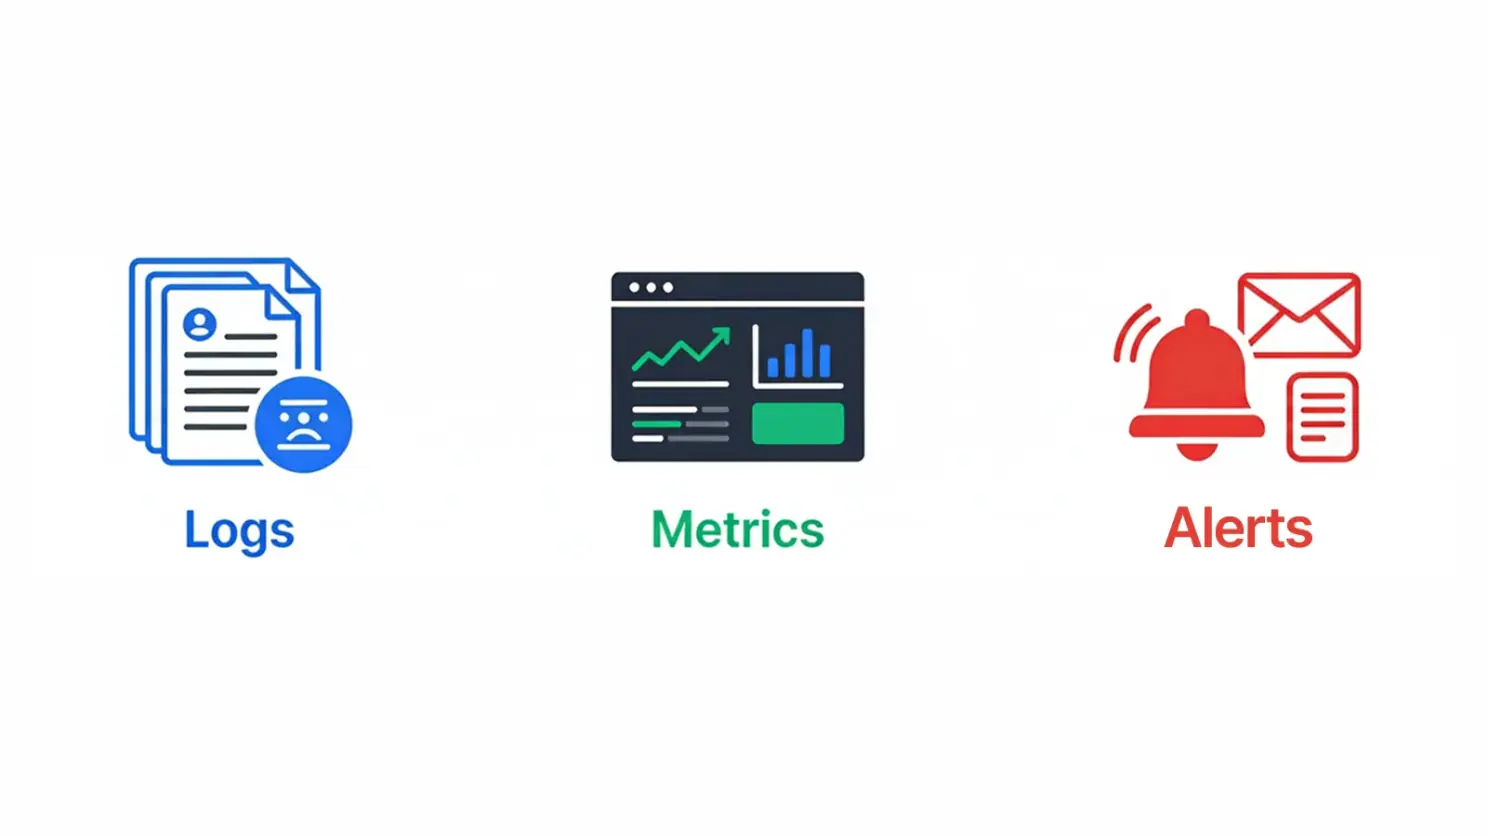
By the end of this lesson you will understand the three pillars of observability — logs, metrics, and alerts — and know how to apply each one to a real system.
You cannot improve what you cannot see. Observability is the discipline of making your system's internal state visible from the outside, without having to redeploy code every time something goes wrong.
The three pillars
Logs
A log is a timestamped record of a discrete event. Logs tell you what happened at a specific moment in time.
Good logs are:
- Structured — written as key-value pairs (JSON) rather than free-form strings, so they can be queried programmatically.
- Contextual — they include a request ID, user ID, or trace ID so you can group related events together.
- Actionable — they contain enough information to understand the event without having to look at the source code.
Metrics
A metric is a numeric measurement sampled over time. Metrics tell you how much and how fast.
Common system metrics include:
- Request rate — how many requests per second your system is handling.
- Error rate — what percentage of requests are failing.
- Latency — how long requests are taking (p50, p95, p99 percentiles matter more than averages).
- Saturation — how close your resources (CPU, memory, disk I/O) are to their limits.
These four — collectively known as the RED method (Rate, Errors, Duration) — cover most of what you need to understand the health of a service.
Alert
Observability data is only useful if someone acts on it. A good alerting strategy:
- Alerts on symptoms (high error rate, high latency) rather than causes (high CPU).
- Avoids alert fatigue by keeping the signal-to-noise ratio high.
- Defines clear runbooks so on-call engineers know what to do when an alert fires.
Key takeaways
- Logs record discrete events. Make them structured and contextual.
- Metrics measure system behaviour over time. Track rate, errors, and latency as your baseline.
- Alert on user-facing symptoms, not internal resource usage.